COVID-19 Testing in Ottawa Neighbourhoods
Note from Ottawa Public Health:
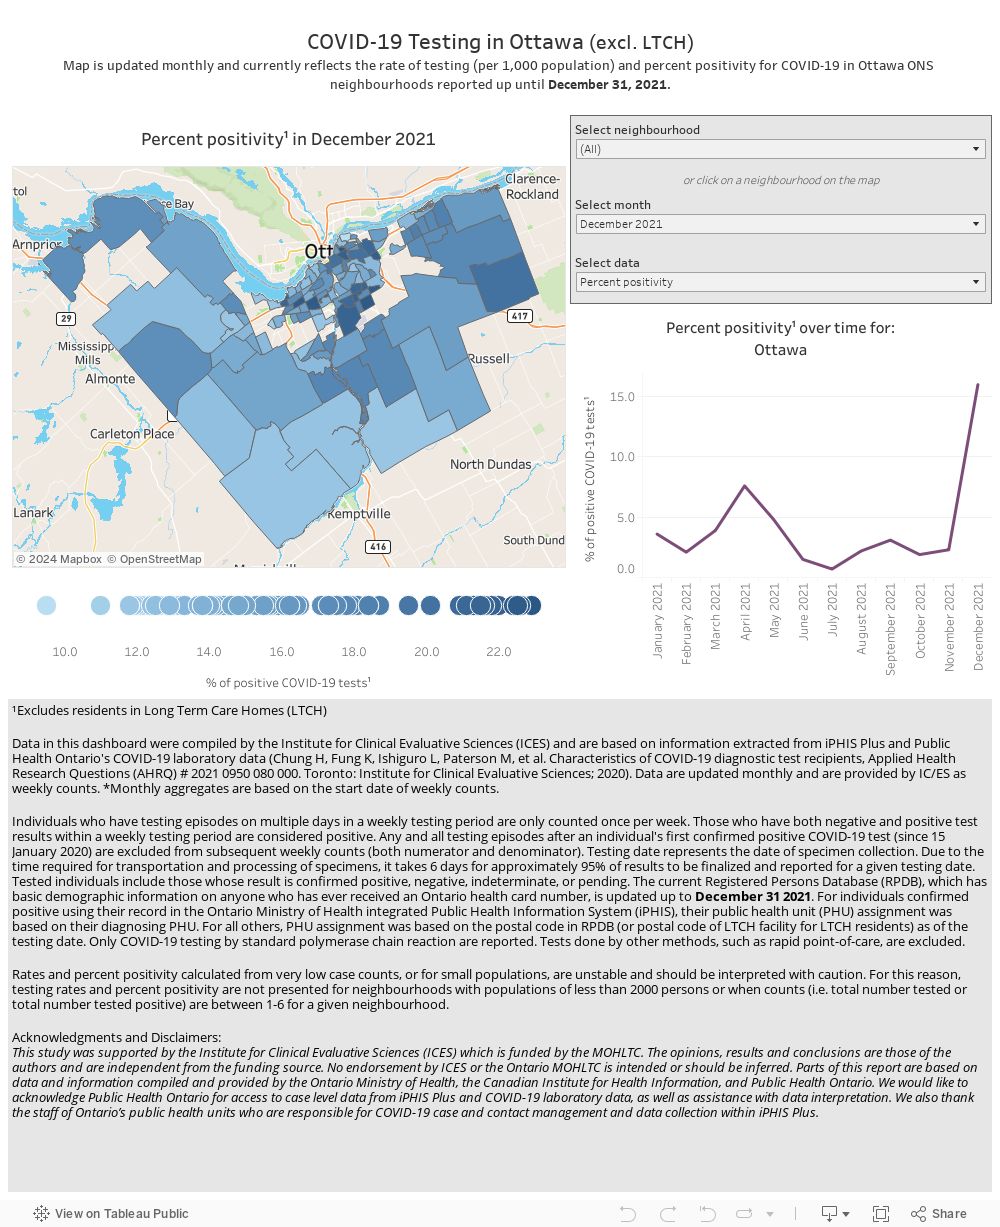
In response to the rapid transmission of the Omicron variant, starting December 31, 2021, the Ontario Ministry of Health further limited testing eligibility in order to preserve capacity. The cases identified since these changes went into effect provide a less accurate picture of overall COVID-19 activity, or activity by Ward or neighbourhood, in Ottawa. Therefore, we are pausing updating the COVID-19 Rates by Ward/Neighbourhood dashboards, including the COVID-19 cases dashboard on the ONS website. Historical data will remain available on the OPH, ONS, and Open Ottawa websites.
OPH will continue to monitor and provide relevant and timely information on the evolving COVID-19 pandemic including hospitalization and death rates, outbreaks in institutional settings, vaccination rates, and wastewater surveillance. In addition, vaccination rates by neighbourhood will continue to be updated to support monitoring of protection against COVID-19 infection across Ottawa.
Testing is essential for monitoring COVID-19 in our community. The map below provides a snapshot of COVID-19 testing rates and percent positivity across Ottawa neigbourhoods. Areas with lower or higher percent positivity are not more or less “safe” from COVID-19 transmission. Ottawa Public Health (OPH) has partnered with the Ottawa Neighbourhood Study (ONS) to share this information in the interest of transparency. OPH continues to work with its partners to ensure we support the needs of Ottawa’s communities.
This information needs to be balanced with a recognition that it may stigmatize people and communities who have been impacted by COVID-19. Please take a moment to review OPH’s position statement on stigma, which provides guidance on language to use when communicating about COVID-19.
Factors that may be driving the testing rates and percent positivity of COVID-19 in Ottawa neighbourhoods:
- Rurality: To account for differences in the size of urban and rural populations, rates (i.e. the number of persons tested per 1000 population) are provided. Testing rates in rural neighbourhoods will be more sensitive to changes as they have smaller populations.
- Testing: Provincial testing criteria have varied throughout the response and been limited to priority groups when laboratory capacity was more limited. Also, testing rates are not uniform across the city: according to an ICES report, Ontarians who were tested were more likely than those not tested to live in marginalized neighbourhoods with greater residential instability, material deprivation and dependency, and lower income status.
- Social determinants of health: The social determinants of health, such as income and ethnicity, can contribute to differences in disease prevalence and health behaviours. According to an ICES report, Ontarians who tested positive for COVID-19 were more likely to live in lower-income neighbourhoods or neighbourhoods with a higher percentage of visible minorities and recent immigrants.
The map below is based on the neighbourhood of residence of Ottawans that have undergone COVID-19 testing and, in the case of those with positive test results, does not necessarily reflect where they “caught” the virus. Exposure to COVID-19 can occur anywhere people congregate, such as workplaces or services open to the public. The best way to limit your exposure to COVID-19 is to practice physical distancing with those outside your household, wear a mask where required and when you cannot maintain physical distance, and wash your hands regularly.
The data table for this map is available for download on Open Ottawa