ONS Data Methodology: Percentage of Population Served
Objective
To estimate the percentage of population adequately served by community recreational services in Ottawa neighbourhoods.
Method
A road distance of 1.5 km was chosen as the threshold (population within this distance from the facility is considered “served”) following the Recreation Service Plan 2013 – 2017, City of Toronto. In Toronto, the average user of free-of-charge recreation centres travels 1.8 km to take a program, and City of Toronto uses a slightly more conservative distance of 1.5 km to identity underserved regions.
In Ottawa, winter outdoor recreation facilities, including sledding hills and hockey rinks operated by City of Ottawa, were chosen for demonstration here. We are planning to do the same for summer outdoor recreation facilities and summer water recreation facilities.
The service areas (areas within 1.5 km) of these facilities were calculated using the Service Area function of the Network Analyst extension in ArcGIS 10.6. Centroids of dissemination blocks were used to model the distribution of population.
Percentage of population served by the facilities in a neighbourhood is calculated as:
Sum(population within 1.5 km) / Sum(total population)
Sources:
- Network dataset: DMTI CanMap 2018
- Point features: Open Data Ottawa
- Dissemination blocks and population: Statistics Canada
Reference
Service area analysis—Help | ArcGIS Desktop. (2019). Retrieved July 10, 2019, from http://desktop.arcgis.com/en/arcmap/latest/extensions/network-analyst/service-area.htm
Examples
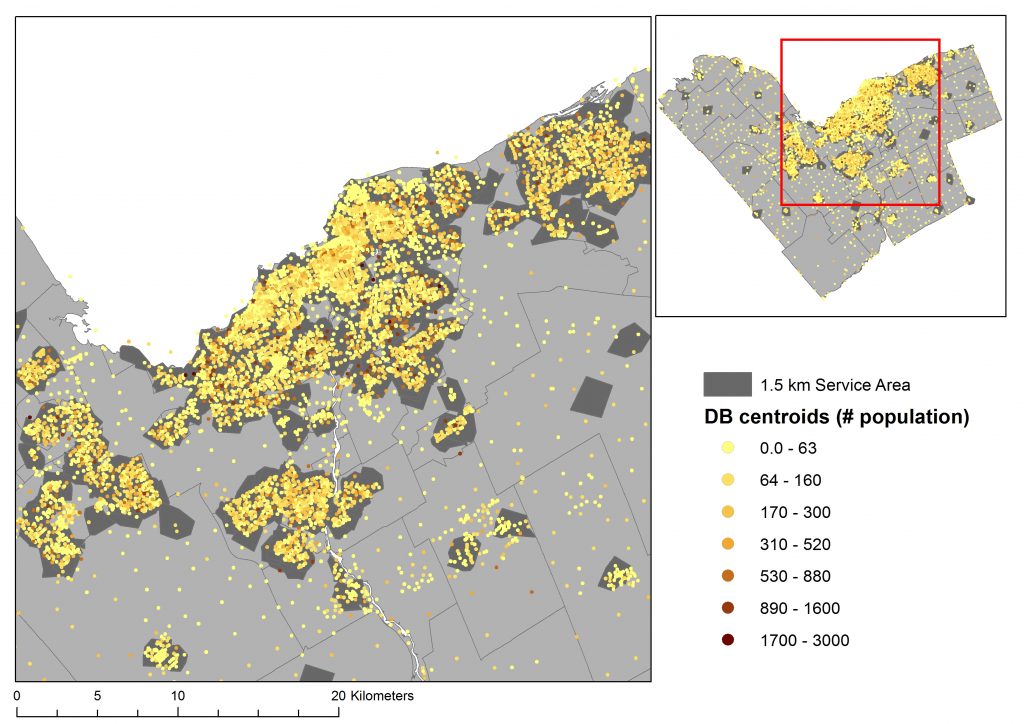
Figure 1. Service area of winter recreation facilities and population of dissemination block centroids in Ottawa, threshold = 1.5 km road distance.
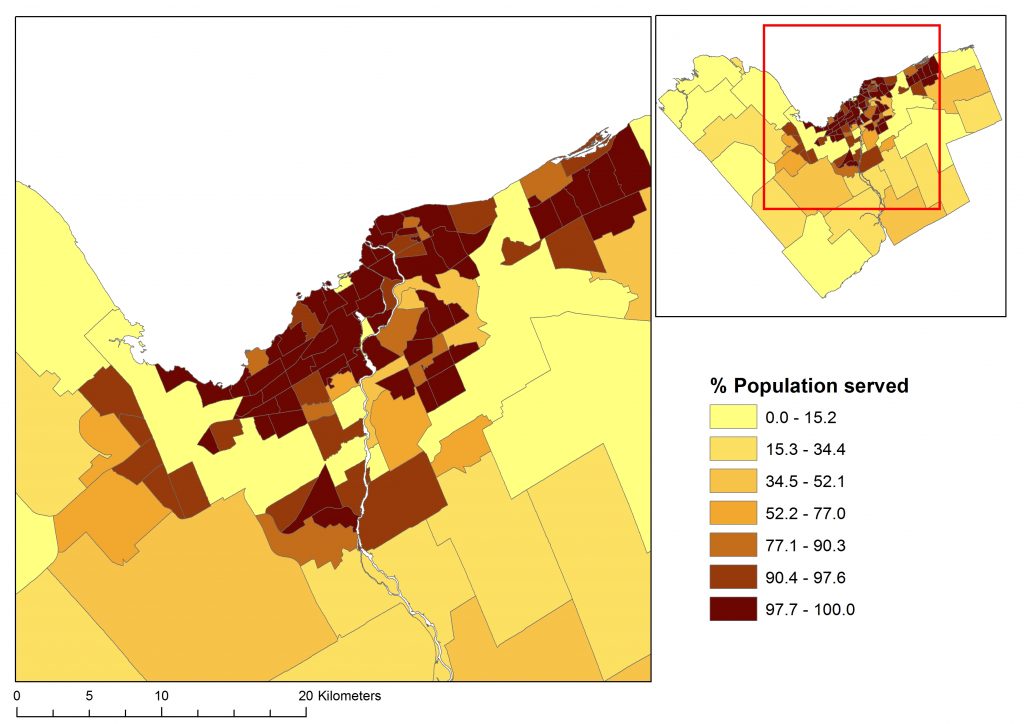
Figure 2. Percentage of population served by winter recreation facilities in Ottawa neighbourhoods, threshold = 1.5 km road distance.