OTT-Marg
Introduction
It is well known that the socioeconomic gradient plays a large role in the health of industrialized countries, including Canada (Marmot, 2003; Pampalon et al., 2010; Pickett & Pearl, 2001). However, to fully understand the relationship between neighbourhood socioeconomic status (SES), other social determinants of health, and overall well-being of Canadian citizens, it is imperative to consider a wide-range of SES-related variables to reflect the complexity of society (Chan et al., 2015). The Ontario Marginalization Index (ON-Marg) was thus adapted from the Canadian Marginalization Index (CAN-Marg) using Ontario-specific data, which built off previously established deprivation indices while also considering other SES-related factors such as ethno-racial identity, household structure and immigration status (F. I. Matheson et al., 2012). CAN-Marg, and thus ON-Marg, consist of four dimensions of marginalization: (1) residential instability, (2) material deprivation, (3) ethnic concentration, and (4) dependency.
CAN-Marg has been shown to be stable across different time periods and geographical regions and has generally outperformed other established area-based SES indices, such as the Raymond-Pampalon indices and Socioeconomic Factor Index (SEFI), in direct retrospective comparison studies (Flora Matheson & Moloney, 2018; Sharma et al., 2020; Webb et al., 2017). ON-Marg was previously used in Ottawa and Ontario to show marginalization-associated inequalities in, but not limited to, multimorbidity, healthcare engagement and numerous specific health outcomes (Lachaud et al., 2017; McDonald et al., 2020; Moin et al., 2018; Zygmunt et al., 2020).
However, CAN-Marg and ON-Marg were designed using census geographies, which have received criticism for representing artificial [KC1] boundaries without respect for social or health-based patterns within them (Germain & Gagnon, 1999; Kawachi & Berkman, 2004; Sawada et al., 2008). Therefore, we were interested in marginalization of “natural” neighbourhoods of Ottawa as developed by (Sawada et al., 2008), and thus ON-Marg was adapted to custom Ottawa geographies. This index will henceforth be termed “OTT-Marg”. This process of adapting an established SES index to custom geographies across Canada was previously completed for CAN-Marg by Webb et al., 2017, but the authors still relied on census boundaries. The purpose of OTT-Marg development was to therefore provide a comprehensive marginalization index customized for the City of Ottawa to be used to better understand the interplay between SES and social determinants of health with the well-being of Ottawa’s neighbourhoods.
Methodology
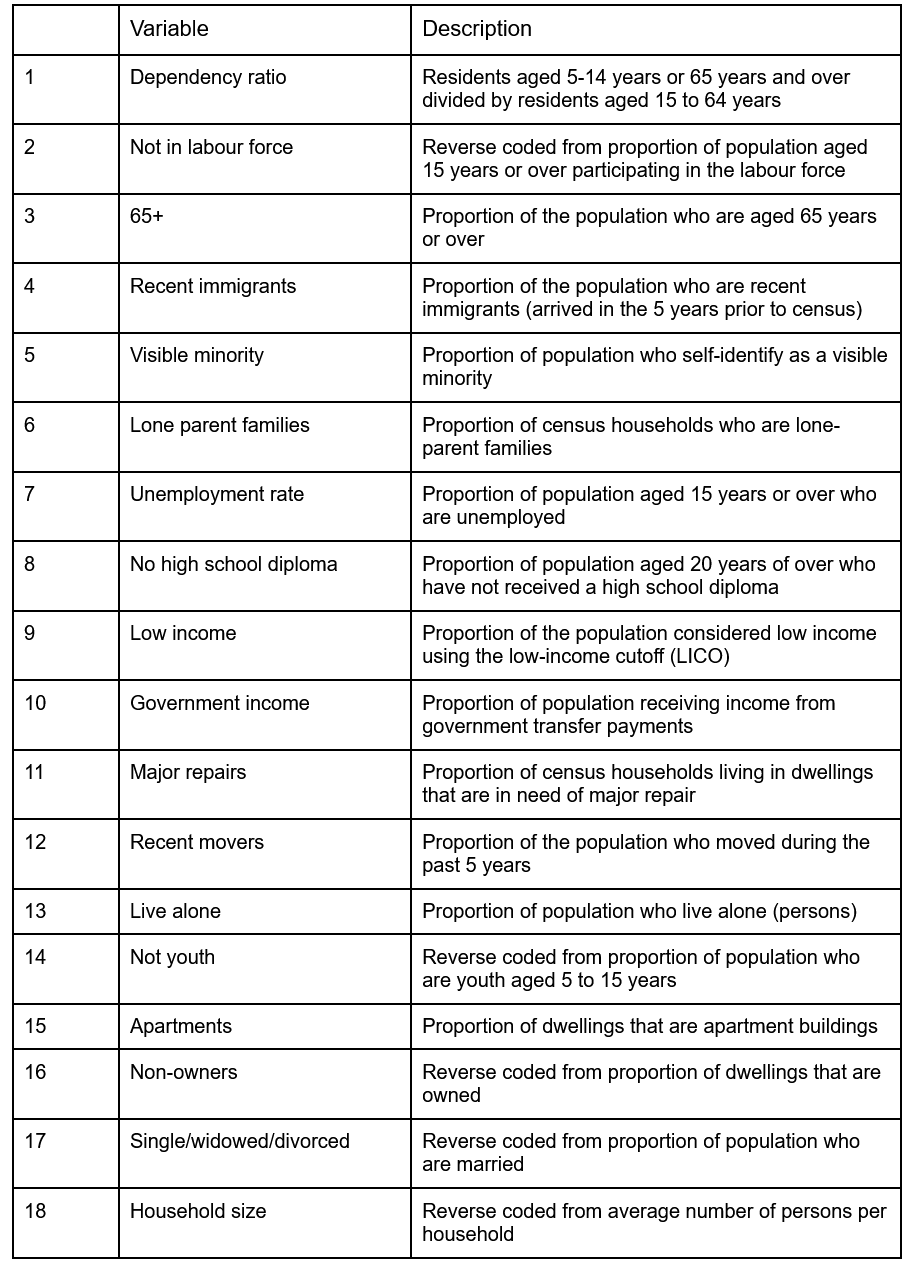
Following literature review, 42 initial variables from the 2001 Statistics Canada Census were chosen by the developers of CAN-Marg and reduced to 18 in four components with Principal Component Analysis (PCA) as described in (F. I. Matheson et al., 2012). ON-Marg was adapted from CAN-Marg using PCA with same 18 final variables. Thus, final variables (n=18, Table 1) were extracted from the 2016 Statistics Canada Census for 103 custom neighbourhoods for OTT-Marg adaptation.
Table 1. Final variables for the development of OTT-Marg and their descriptions.

Neighbourhoods with population sizes smaller than 1,000 were excluded from the analysis. Most of these neighbourhoods had very insignificant population sizes and were industrial areas of Ottawa. The following seven neighbourhoods were excluded:
· Beechwood Cemetery
· Carleton University
· Hunt Club South Industrial
· Lebreton Development
· Notre-Dame Cemetery
· Orleans Industrial
· Watering Village
In addition to the seven excluded neighbourhoods, the Greenbelt was suppressed due to its small population size and large area covering (not appropriate for an area-based analysis). This left a sample size of n=103 for the PCA analysis.
OTT-Marg was then developed using publicly available methodology and consultation with Public Health Ontario (Flora Matheson & Moloney, 2018; F. Matheson et al., 2017) There is no suggestion of normalization used in ON-Marg creation, so all indicators are included in their original state. PCA with oblique rotation (kappa=3) was used for the 18 identified variables. Variables that loaded highly in more than one component were interpreted as being included in the factor with the highest loading. Quintiles were calculated for each dimension by ranking the factor scores and dividing the neighbourhoods into five equal groups (Q1-Q5). OTT-Marg summary score was calculated by taking the average quintile score for the four dimensions.
Results
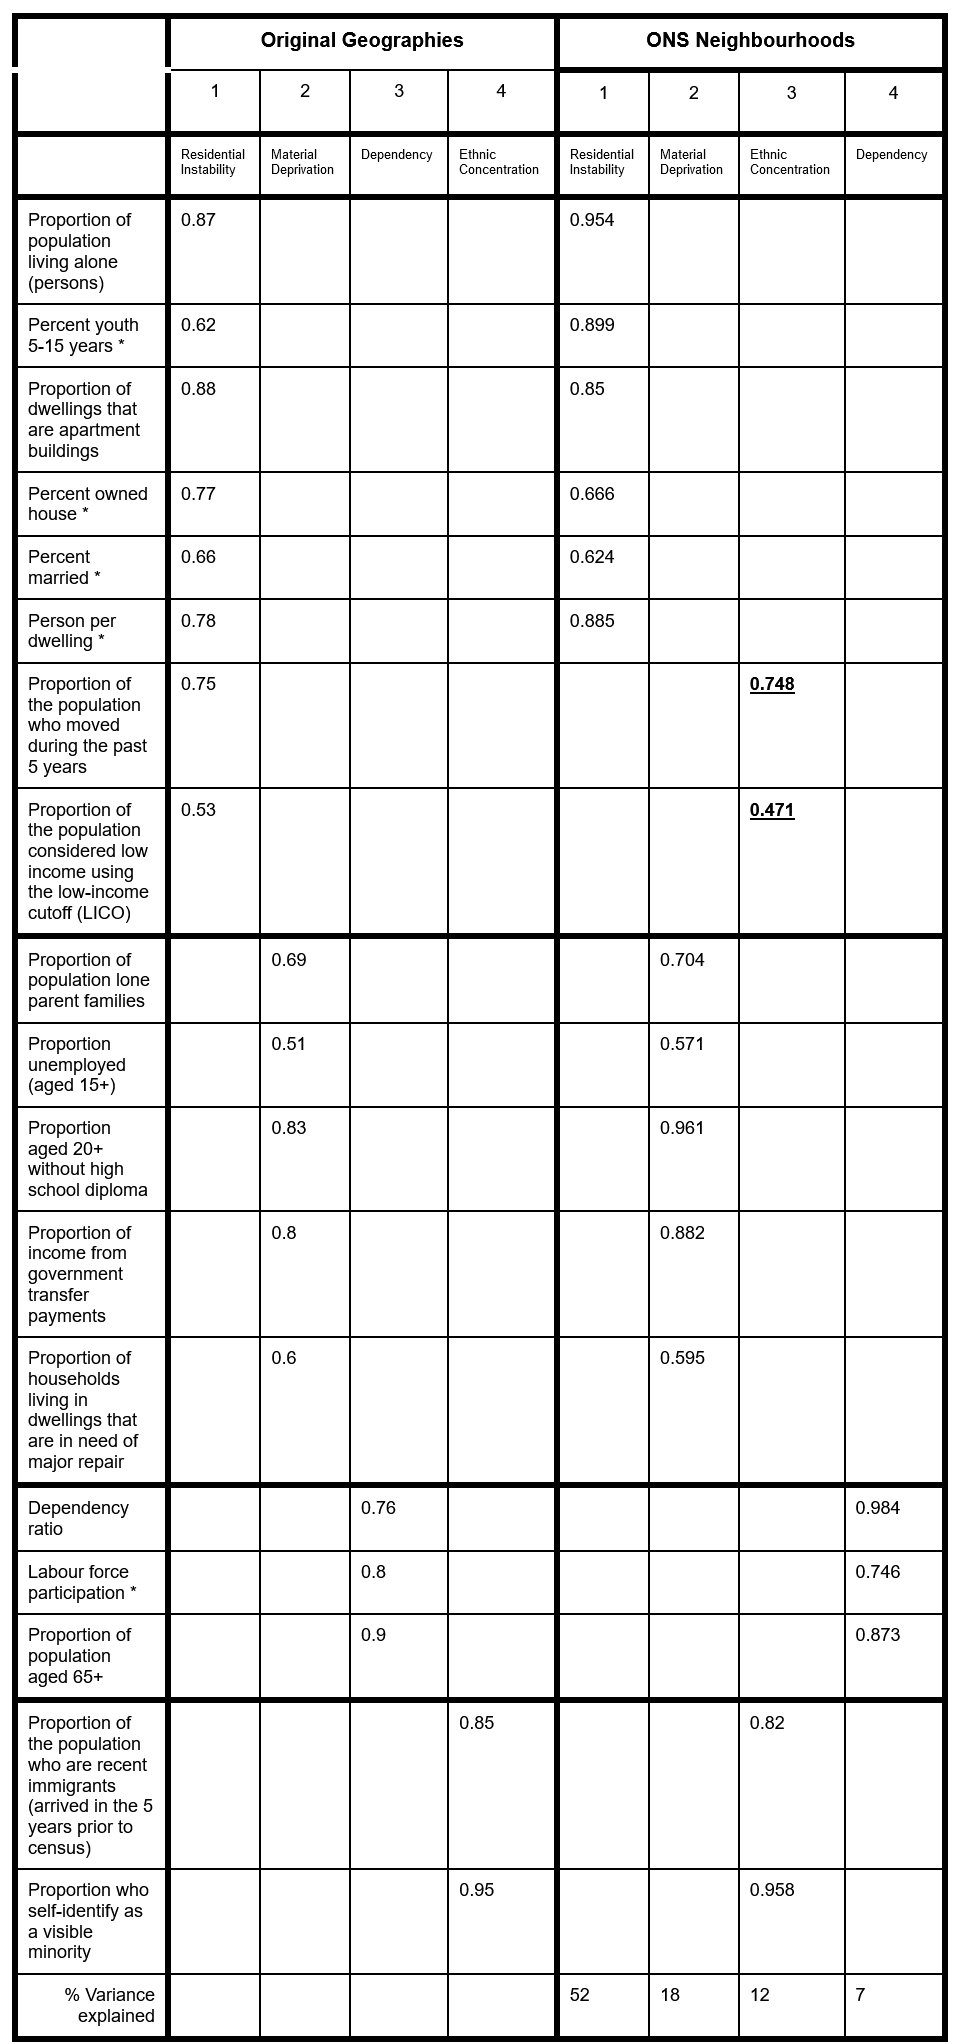
Four components were extracted with PCA with oblique rotation based on Eigenvalues greater than 1 and visual inspection of the scree plot. The Kaiser-Meyer-Olkin Measure of Sampling Adequacy (0.800) and Bartlett’s test of Sphericity (Chi-square=2975.99, p<0.001) suggest our data are appropriate for PCA. Table 2 shows the structure matrix of the PCA results from 2016 ON-Marg compared to that of OTT-Marg. Variables that loaded differently to ON-Marg are highlighted in bold and underlined. Due to the relative similarity between the indices, the same dimension names are used for OTT-Marg components (i.e., residential instability, material deprivation, ethnic concentration and dependency). Cumulatively, 88.6% of the variance in our dataset is explained by the four components.
Table 2. Rotated component loadingsa for PCA using the original geographies in (Flora Matheson & Moloney, 2018) and ONS neighbourhoods. Components are ordered by percentage of variance explained (listed in final row for OTT-Marg, not available for ON-Marg).

a Rotation Method: Promax with Kaiser Normalization. Factor loadings > 0.4 are presented.
* Variables reverse coded in both datasets
Factor scores from the index were converted to quintile scores for each dimension, and an OTT-Marg summary score was calculated by taking the average quintile score across the four dimensions. Maps are provided in Figure 1A-D below, with quintile 1 (most advantaged) shaded in the lightest green, and quintile 5 (most disadvantaged) shaded in the darkest green.
Figure 1. Maps of OTT-Marg dimension quintile scores per neighbourhood: (A) Residential instability, (B) Material deprivation, (C) Ethnicity, and (D) Dependency. Light green represents quintile 1 (most advantaged) and dark green represents quintile 5 (most disadvantaged).
Conclusion
The purpose of the adaptation of the Ontario Marginalization Index to OTT-Marg was to provide a previously established marginalization index in the context of the rigorously designed ‘natural’ neighbourhoods by the Ottawa Neighbourhood Study (Sawada et al., 2008). We hope that OTT-Marg can be used by health policymakers and other experts in Ottawa to identify disadvantaged neighbourhoods and target health and social interventions appropriately. We also hope this process of adapting an established index to a designed area provides a framework for future work in different locations.
However, this work is not without its limitations. First, although we attempted to follow the methodology described by creators of ON-Marg as closely as possible, not all of the details required are publicly available. For example, it was unclear as to how the authors determined what was considered a ‘meaningful’ factor loading and how the dimensions were interpreted when a variable loaded strongly in more than one. Second, as we attempted to reproduce the 2016 ON-Marg methodology as closely as possible, we did not begin our adaptation with the 42 original CAN-Marg variables. This is a limitation as it is not clear whether the same 18 final variables would be selected by PCA as the most relevant marginalization indicators in an Ottawa-specific context.
Next, it is important to note that the 2016 Canadian Census only reports on the population living in private households, and thus excludes institutionalized populations (i.e., prisons, nursing homes, long-term care homes) and Indigenous peoples living on-reserve.
Finally, we conducted our analysis on both urban and rural neighbourhoods of Ottawa. According to (Pampalon et al., 2009), measures of marginalization may perform differently in these settings, and therefore may warrant separate analyses.
References
Chan, E., Serrano, J., Chen, L., Stieb, D. M., Jerrett, M., & Osornio-Vargas, A. (2015). Development of a Canadian socioeconomic status index for the study of health outcomes related to environmental pollution. BMC Public Health 2015 15:1, 15(1), 1–8. https://doi.org/10.1186/S12889-015-1992-Y
Flora Matheson, A. I., & Moloney, G. (2018). 2016 Ontario Marginalization Index. October.
Germain, A., & Gagnon, J. E. (1999). Is Neighbourhood a Black Box? A Reply to Galster, Metzger and Waite. Canadian Journal of Urban Research, 8(2), 172. https://www.jstor.org/stable/pdf/44318010.pdf?casa_token=WMHqyAYqrG8AAAAA:HwHSW-vlSW_uwbctD__hLil27lp_RLNGYYzVZlEnr5M-gjMkMoIP6r9be2pOs_O44KuFcbdcbfB0XKjacIojkjbezUNsgY8jP8HQnwLdLE06mPdW6kx61Q
Kawachi, I., & Berkman, L. F. (2004). Introduction in Neighborhoods and Health. In Neighborhoods and Health (Vol. 1, pp. 1–19). Oxford University Press. https://books.google.ca/books?hl=en&lr=&id=s1-FVY4IFU4C&oi=fnd&pg=PR9&dq=kawachi+berkman+2004+neighborhoods+and+health&ots=2NbyBo8TK7&sig=XSN0eK_gc3ZNw0P_DLhTrBWnuuE#v=onepage&q&f=false
Lachaud, J., Donnelly, P. D., Henry, D., Kornas, K., Calzavara, A., Bornbaum, C., & Rosella, L. (2017). A population-based study of homicide deaths in Ontario, Canada using linked death records. International Journal for Equity in Health, 16(1), 1–7. https://doi.org/10.1186/s12939-017-0632-9
Marmot, M. (2003). Understanding social inequalities in health . Perspectives in Biology and Medicine, 46(3), S9-23. https://doi.org/10.1353/pbm.2003.0056
Matheson, F. I., Dunn, J. R., Smith, K. L. W., Moineddin, R., & Glazier, R. H. (2012). Development of the Canadian Marginalization index: A new tool for the study of inequality. Canadian Journal of Public Health, 103(SUPPL.2). https://doi.org/10.1007/bf03403823
Matheson, F., van Ingen, T., & Ontario Agency for Health Protection and Promotion (Public Health Ontario). (2017). 2011 Ontario Marginalization Index: Technical Document. In Joint publication with Public Health Ontario (Issue November).
McDonald, E. J., Quick, M., & Oremus, M. (2020). Examining the association between community-level marginalization and emergency room wait time in Ontario, Canada. Healthcare Policy, 15(4), 64–76. https://doi.org/10.12927/HCPOL.2020.26223
Moin, J. S., Moineddin, R., & Grant Upshur, R. E. (2018). Measuring the association between marginalization and multimorbidity in Ontario, Canada: A cross-sectional study. Journal of Comorbidity, 8, 1–9. https://doi.org/10.1177/2235042X18814939
Pampalon, R., Hamel, D., & Gamache, P. (2010). Health inequalities in urban and rural Canada: Comparing inequalities in survival according to an individual and area-based deprivation index. Health & Place, 16(2), 416–420. https://doi.org/10.1016/J.HEALTHPLACE.2009.11.012
Pampalon, R., Hamel, D., Gamache, P., & Raymond, G. (2009). A deprivation index for health planning in Canada. Chronic Diseases in Canada, 29(4), 178–191. https://doi.org/10.24095/hpcdp.29.4.05
Pickett, K. E., & Pearl, M. (2001). Multilevel analyses of neighbourhood socioeconomic context and health outcomes: a critical review. J Epidemiol Community Health, 55, 111–122. https://doi.org/10.1136/jech.55.2.111
Sawada, M. C., Kristjansson, E., Labonté, R., & Runnels, V. (2008). Development of Neighborhoods to Measure Spatial Indicators of Health. URISA Journal, 20(2). https://www.researchgate.net/publication/237050477
Sharma, A. K., Kroeker, K., Chateau, D., Brownell, M., & Rodd, C. J. (2020). Assessing childhood health outcome inequalities with area-based socioeconomic measures: a retrospective cross-sectional study using Manitoba population data. Pediatric Research, 88(3), 496–502. https://doi.org/10.1038/s41390-020-0755-3
Webb, S., Janus, M., Duku, E., Raos, R., Brownell, M., Forer, B., Guhn, M., & Muhajarine, N. (2017). Neighbourhood socioeconomic status indices and early childhood development. SSM – Population Health, 3, 48–56. https://doi.org/10.1016/j.ssmph.2016.11.006
Zygmunt, A., Kendall, C. E., James, · Paul, Lima, I., Meltem Tuna, ·, & Tanuseputro, · Peter. (2020). Avoidable Mortality Rates Decrease but Inequity Gaps Widen for Marginalized Neighborhoods: A Population-Based Analysis in Ontario, Canada from 1993 to 2014. Journal of Community Health, 45, 579–597. https://doi.org/10.1007/s10900-019-00778-8
