COVID-19 in Ottawa Neighbourhoods
Note from Ottawa Public Health:
In response to the rapid transmission of the Omicron variant, starting December 31, 2021, the Ontario Ministry of Health further limited testing eligibility in order to preserve capacity. The cases identified since these changes went into effect provide a less accurate picture of overall COVID-19 activity, or activity by Ward or neighbourhood, in Ottawa. Therefore, we are pausing updating the COVID-19 Rates by Ward/Neighbourhood dashboards, including the COVID-19 cases dashboard on the ONS website. Historical data will remain available on the OPH, ONS, and Open Ottawa websites.
OPH will continue to monitor and provide relevant and timely information on the evolving COVID-19 pandemic including hospitalization and death rates, outbreaks in institutional settings, vaccination rates, and wastewater surveillance. In addition, vaccination rates by neighbourhood will continue to be updated to support monitoring of protection against COVID-19 infection across Ottawa.
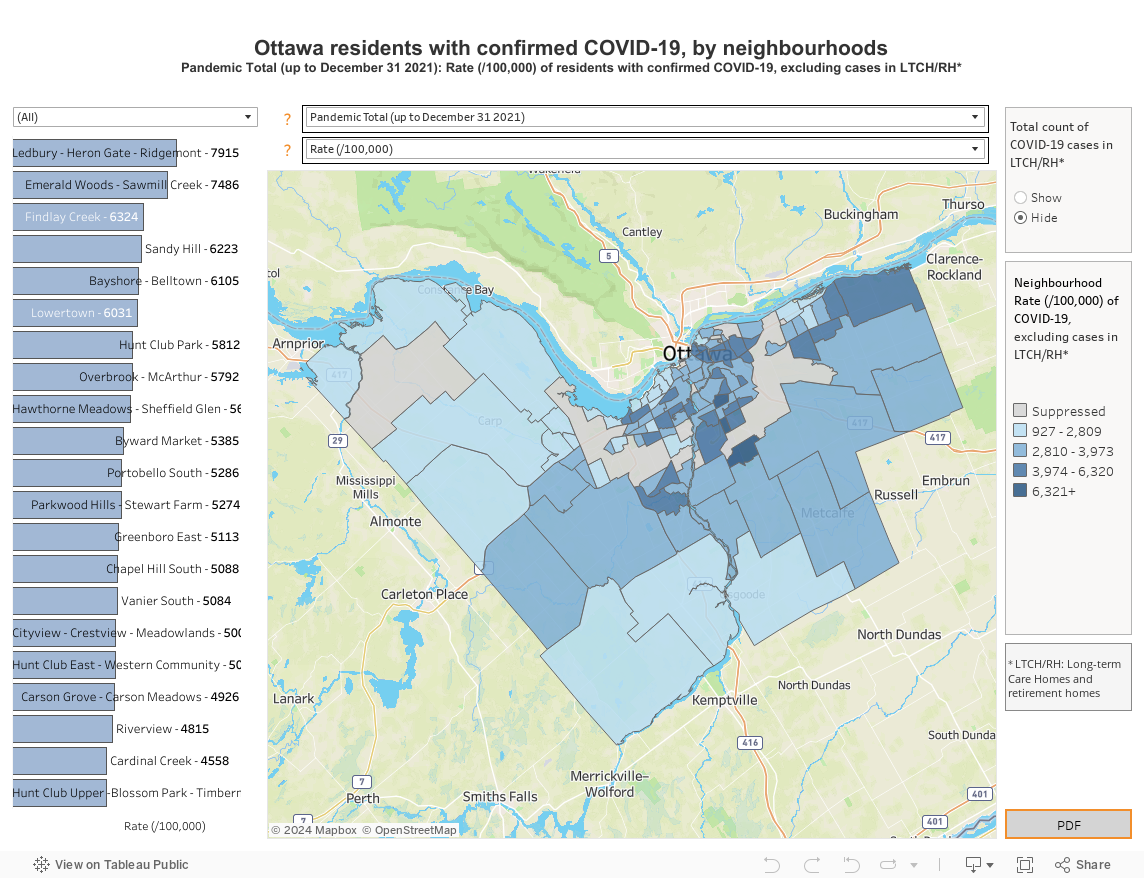
COVID-19 is present in every single community within Ottawa. The map below provides a snapshot of COVID-19 across Ottawa neigbourhoods. Areas with lower or higher rates are not more or less “safe” from COVID-19 transmission. Ottawa Public Health (OPH) has partnered with the Ottawa Neighbourhood Study (ONS) to share this information in the interest of transparency. OPH continues to work with its partners to ensure we support the needs of Ottawa’s communities.
This information needs to be balanced with a recognition that it may stigmatize people and communities who have been impacted by COVID-19. Please take a moment to review OPH’s position statement on stigma, which provides guidance on language to use when communicating about COVID-19.
Factors that may be driving the observed rates of COVID-19 in Ottawa neighbourhoods:
- Rurality: To account for differences in the size of urban and rural populations, rates (i.e. the number of COVID-19 cases per 100 000 population) are provided. Rates in rural neighbourhoods will be more sensitive to changes in the number residents with confirmed COVID-19 infection, as they have smaller populations.
- Testing: Testing is essential for monitoring COVID-19 in our community. Provincial testing criteria have varied throughout the response and been limited to priority groups when laboratory capacity was more limited. The number of reported confirmed community cases underestimates the actual number of infections. Testing rates are not uniform across the city: according to an ICES report, Ontarians who were tested were more likely than those not tested to live in marginalized neighbourhoods with greater residential instability, material deprivation and dependency, and lower income status.
- Social determinants of health: The social determinants of health, such as income and ethnicity, can contribute to differences in disease prevalence and health behaviours. According to an ICES report, Ontarians who tested positive for COVID-19 were more likely to live in lower-income neighbourhoods or neighbourhoods with a higher percentage of visible minorities and recent immigrants.
The map below is based on the neighbourhood of residence of Ottawans with confirmed COVID-19 infection and does not necessarily reflect where the people “caught” the virus. Exposure to COVID-19 can occur anywhere people congregate, such as workplaces or services open to the public. The best way to limit your exposure to COVID-19 is to practice physical distancing with those outside your household, wear a mask where required and when you cannot maintain physical distance, and wash your hands regularly.
The map is updated monthly and currently reflects the number and rate of Ottawa residents who tested positive for COVID-19 by December 31, 2021.
**Please note the neighbourhood population estimates used as the denominator to calculate the COVID-19 neighbourhood rates have been updated. These new estimates more accurately reflect current population sizes (excluding LTCH residents) and were compiled by ICES (January to March 2021). For this reason, cumulative and monthly rates may differ from previous publications.
*** Please also note OPH has migrated from The COD to CCM, the provincial database for COVID-19. The March 2021 ONS COVID-19 update was the first ONS neighbourhood data to be pulled from CCM and monthly counts in some neighbourhoods may have changed slightly due to differences in postal code attribution across the two systems.
Map Data Notes :
- Data represents all cases reported from March 2020 to December 2021 and was extracted by Ottawa Public Health (OPH) from the provincial Case and Contact Management (CCM) solution. The CCM is a dynamic disease reporting system that allow for continuous updates of case information. These data are a snapshot in time, reflect the most accurate information that OPH has at the time of reporting, and the numbers may differ from other sources.
- A case (an individual with laboratory-confirmed COVID-19 infection) is assigned to an Ottawa Neighbourhood Study (ONS) geography based on the individual’s residential postal code and the ONS’s postal code conversion file. As the area served by a given postal code may cross multiple neighbourhoods, the ONS postal code conversion file identifies the proportion of each postal code that falls within a neighbourhood. Thus, for cases with postal codes falling within multiple neighbourhoods, a fraction of those cases will be assigned to each neighbourhood.
- Neighbourhood rates are suppressed if case counts are less than 5 and if the total neighbourhood population (excluding LTCH residents) is less than 2000 people. Rates calculated from very low case counts, or for small populations, are unstable and should be interpreted with caution. A low case count for a given neighbourhood results in a very wide 95% confidence interval for the estimated rate; this interval is comprised of the lower and upper limits within which the true rate lies 95% of the time. A narrow confidence interval corresponds to a more precise estimate and a wider confidence interval corresponds to a less precise estimate. Because of this, rates calculated from very low case counts fluctuate so much that we cannot use them to compare different areas or make predictions over time.
- Non-LTCH population estimates by ONS neighbourhood are based on data provided by the Institute for Clinical Evaluative Services (ICES) (Chung H, Fung K, Ishiguro L, Paterson M, et al. Characteristics of COVID-19 diagnostic test recipients, Applied Health Research Questions (AHRQ) # 2021 0950 080 000. Toronto: Institute for Clinical Evaluative Sciences; 2020). Populations are estimated by linking the most recent postal code in the current Registered Persons Database (RPDB), which has basic demographic information on anyone who has ever received an Ontario health card number to ONS neighbourhoods using the ONS’s postal code conversion file. These datasets were linked using unique encoded identifiers and analyzed at ICES. The data were received by OPH as weekly population estimates from January 2021 to March 2021, these were then averaged to produce a non-LTCH population estimate for ONS neighbourhoods.
The data table for this map is available for download on Open Ottawa