Britannia
Description
Britannia is bounded by the Ottawa River to the north, Richmond Road to the south, the Sir John A MacDonald Parkway to the east, and Boyce Avenue to the west. The area has long enjoyed a reputation in the city for its excellent river access, parklands, proximity to the Mud Lake bird sanctuary, and recreation opportunities. This neighbourhood includes Lincoln Heights and Britannia Village (known locally simply as “The Village”).
Britannia Village is bounded by the Ottawa River to the North and West, Mud Lake Conservation area to the east, and the old CPR line (now the Trans-Canada Trail) to the south. This community initially grew around property developed by Capt. John Lebreton in the early 1820s; a grist mill, saw mill and a house that he called Britannia. The CPR line stimulated growth, with the first subdivision created in the 1870s. Britannia Village benefited from its location on Lac Deschenes, across from Aylmer QC, and increasing numbers of people sought out the area for pleasure activities; the Ottawa Electric Railway completed its streetcar line to a new park on Britannia Bay, a 1000 foot pier, auditorium, bathing houses, and pavilions, attracting up to 6000 visitors each day in the early 1900s. Britannia Village remained a predominantly summer cottage community until after WWII, when large numbers of returning veterans moved to the area in search of affordable housing. The village was annexed to the city of Ottawa in 1950, and by the time that the streetcar line closed in 1959, Britannia Park and OER were both owned by the city. A venue for teen dances and theatrical productions, Lakeside Gardens (now named for Ottawa city councilor Ron Kolbus), was built in 1958. The path taken by the CPR line is now part of an extensive network of pedestrian and cycling pathways that extend about 12 km. to the Parliament Buildings downtown. Today many of the Village’s old cottages live on as bungalows in an area surrounded by water, forest and hills.
This neighbourhood is home to Britannia Beach and the Britannia Yacht Club (est. 1887), a private social club, yacht club, and tennis club located on an extension of land at the East end of Lac Deschenes near the Deschenes Rapids on the Ottawa River; the Olde Forge Community Resource Centre, a non-profit organization that is located in a historic building and offers programs and services to seniors and adults with disabilities; the Lincoln Fields transit station, the area’s main transit hub; and Lincoln Heights Shopping Centre.
View Map
Community Associations & Organizations
Britannia Community Gardens | https://sites.google.com/site/britanniacg/about-us |
Britannia Village Community Association | https://bvcaottawa.wordpress.com/ |
Britannia Woods Community House | http://www.britanniawoods.com/ |
Lincoln Heights Parkway Community Association | https://lhpca.wordpress.com/ |
The Olde Forge Community Resource Centre | http://oldeforge.ca/the-olde-forge-catchment-area/ |
Winthrop Court Community House | https://www.facebook.com/Winthrop-Court-Community-House-PQCHC-764437190355950/?fref=nf |
YMCA/YWCA National Capital Region in Carlingwood | http://www.ymcaywca.ca/locations/carlingwood+y/ |
View Photos

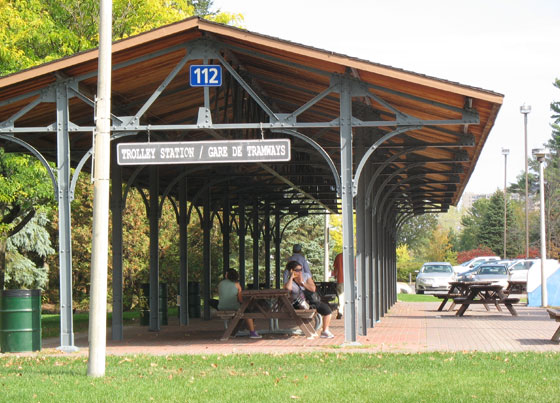
Trolley Station, Britannia Park
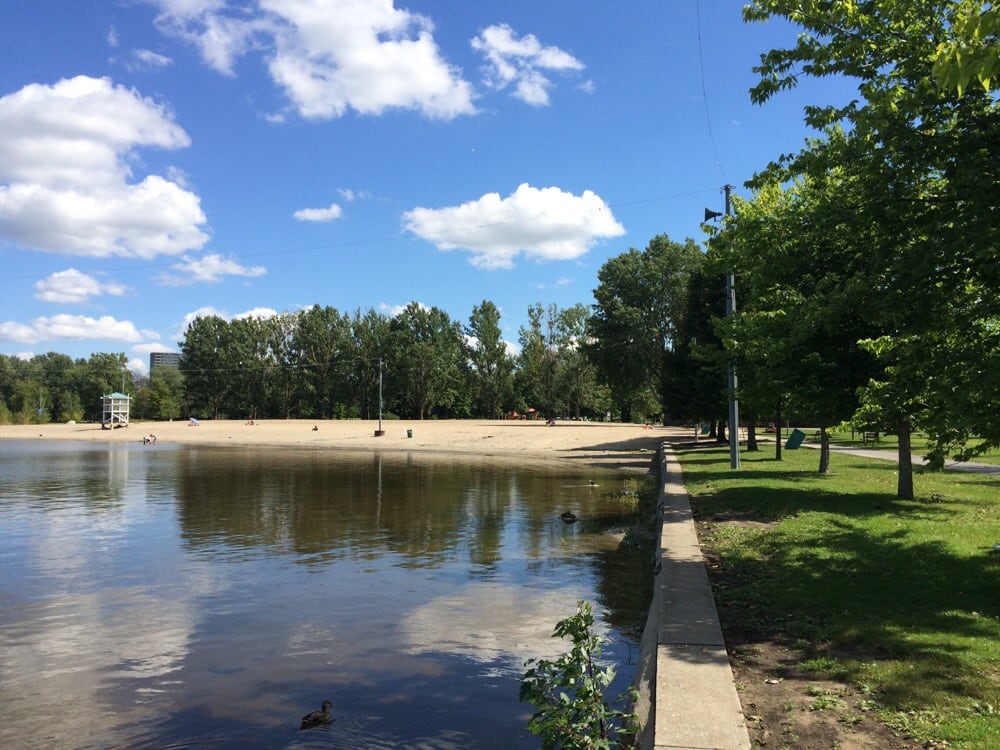
Britannia Beach

Transit Station, Lincoln Fields
Arts & Culture
Variable | Britannia | Average |
---|---|---|
Number of libraries | 0 | 0.3 |
Number of libraries per 1000 residents | 0 | 0 |
Avg. distance to nearest library (km) | 2.6 | 3.6 |
Variable | Britannia | Average |
---|---|---|
Number of bars/nightclubs | 3 | 3.4 |
Number of bars/nightclubs per 1000 people | 0.4 | 0.5 |
Avg. distance to nearest bar or nightclub (km) | 0.9 | 3.2 |
Variable | Britannia | Average |
---|---|---|
Number of sports field on school property per 1000 people | 0 | 0.2 |
Avg. distance to a sports field on school property (km) | 1.9 | 3 |
Number of sports field on school property | 0 | 1.2 |
Variable | Britannia | Average |
---|---|---|
Avg. distance to a baseball diamond (km) | 0.9 | 1.6 |
Number of baseball diamonds | 3 | 2.8 |
Number of baseball diamonds per 1000 people | 0.4 | 0.4 |
Variable | Britannia | Average |
---|---|---|
Avg. distance to a baseball diamond located on a school property (km) | 1 | 4.2 |
Number of baseball diamonds located on a school property | 1 | 0.7 |
Variable | Britannia | Average |
---|---|---|
Avg. distance to a basketball court (km) | 1.5 | 1.9 |
Number of basketball courts | 2 | 2.4 |
Number of basketball courts per 1000 people | 0.3 | 0.3 |
Variable | Britannia | Average |
---|---|---|
Number of community recreation centres | 4 | 1.7 |
Avg. distance to a community recreation centre (km) | 0.8 | 1.8 |
Number of community recreation centres per 1000 people | 0.5 | 0.3 |
Variable | Britannia | Average |
---|---|---|
Number of bowling lawns | 0 | 0.1 |
Avg. distance to a bowling lawn (km) | 7 | 9.4 |
Number of bowling lawns per 1000 people | 0 | 0 |
Variable | Britannia | Average |
---|---|---|
Number of outdoor pools | 0 | 0.1 |
Avg. distance to an outdoor pool (km) | 3.7 | 7.9 |
Number of outdoor pools per 1000 people | 0 | 0 |
Variable | Britannia | Average |
---|---|---|
Number of outdoor wading pools | 1 | 0.6 |
Avg. distance to an outdoor wading pool (km) | 1.5 | 6.7 |
Number of outdoor wading pools per 1000 people | 0.1 | 0.1 |
Variable | Britannia | Average |
---|---|---|
Number of outdoor rinks | 1 | 2.7 |
Avg. distance to an outdoor rink (km) | 0.9 | 1.5 |
Number of outdoor rinks per 1000 people | 0.1 | 0.4 |
Variable | Britannia | Average |
---|---|---|
Number of play structures | 16 | 18.4 |
Avg. distance to a play structure (km) | 0.6 | 1.1 |
Number of play structures per 1000 people | 2.1 | 2.3 |
Variable | Britannia | Average |
---|---|---|
Number of skateboard parks | 0 | 0.2 |
Avg. distance to a skateboard park (km) | 5.1 | 5.1 |
Number of skateboard parks per 1000 people | 0 | 0 |
Variable | Britannia | Average |
---|---|---|
Number of sledding hills | 0 | 0.8 |
Avg. distance to a sledding hill (km) | 1.4 | 4.2 |
Number of sledding hills per 1000 people | 0 | 0.1 |
Variable | Britannia | Average |
---|---|---|
Number of splash pads | 1 | 0.9 |
Avg. distance to a splash pad (km) | 1.2 | 4 |
Number of splash pads per 1000 people | 0.1 | 0.1 |
Variable | Britannia | Average |
---|---|---|
Number of sports fields | 4 | 4.6 |
Avg. distance to a sports field (km) | 0.8 | 1.8 |
Number of sports fields per 1000 people | 0.5 | 0.8 |
Variable | Britannia | Average |
---|---|---|
Number of tennis court | 3 | 1.1 |
Avg. distance to a tennis court (km) | 0.6 | 2.7 |
Number of tennis court per 1000 people | 0.4 | 0.2 |
Variable | Britannia | Average |
---|---|---|
Number of volleyball courts | 0 | 0.3 |
Avg. distance to a volleyball court (km) | 4.5 | 4.7 |
Number of volleyball courts per 1000 people | 0 | 0.1 |
Variable | Britannia | Average |
---|---|---|
Total number of recreational sites per 1000 people | 5.6 | 5.5 |
Total Number of recreational sites | 44 | 42.2 |
Variable | Britannia | Average |
---|---|---|
Number of beaches | 1 | 0 |
Number of beaches per 1000 people | 0.1 | 0 |
Avg. distance to a beach (km) | 1.3 | 10.9 |
Variable | Britannia | Average |
---|---|---|
Number of museums/galleries | 0 | 0.3 |
Number of museums/galleries per 1000 residents | 0 | 0 |
Avg. distance to a museum/gallery (km) | 4.3 | 6 |
Variable | Britannia | Average |
---|---|---|
Number of Dog Parks | 3 | 6.1 |
Number of Dog Parks per 1000 residents | 0.4 | 0.7 |
Average distance to nearest dog park (km) | 0.7 | 3.1 |
Basic Needs & Standard of Living
Variable | Britannia | Average |
---|---|---|
% of single-detached houses | 11.6 | 42.9 |
% of high-rise apartment | 57.3 | 18.5 |
% of movable dwellings | 0 | 0.3 |
% semi-detached | 5.9 | 5.5 |
% row house | 8.3 | 20.6 |
% duplex | 4.5 | 1.9 |
% low-rise apartment | 12.5 | 10.2 |
% other single-attached house | 0 | 0.1 |
Variable | Britannia | Average |
---|---|---|
Number of social and affordable housing units | 607 | 229.4 |
Number of social and affordable housing units per 1000 people | 81.1 | 24.4 |
Variable | Britannia | Average |
---|---|---|
Number of domiciliary hostels | 0 | 0.3 |
Number of domiciliary hostels per 1000 residents | 0 | 0 |
Variable | Britannia | Average |
---|---|---|
Number of long term care homes | 0 | 0.3 |
Number of long term care homes per 1000 residents | 0 | 0 |
Variable | Britannia | Average |
---|---|---|
Number of retirement homes | 0 | 0.7 |
Number of retirement homes per 1000 residents | 0 | 0.1 |
Variable | Britannia | Average |
---|---|---|
# rooming housing | 0 | 1.4 |
# rooming housing per 1000 residents | 0 | 0.1 |
Variable | Britannia | Average |
---|---|---|
% of population aged under 18 living in low income | 38.2 | 16 |
% of population aged 18-64 living in low income | 27 | 11.6 |
% of population aged 65+ living in low income | 9.9 | 6.1 |
Variable | Britannia | Average |
---|---|---|
% only regular maintenance or minor repairs needed | 92.7 | 93.8 |
% major repairs needed | 7.3 | 6.2 |
Variable | Britannia | Average |
---|---|---|
% one person or fewer per room | 98 | 98.3 |
% more than one person per room | 1.9 | 1.7 |
Variable | Britannia | Average |
---|---|---|
% suitable | 90.9 | 94.2 |
% not suitable | 8.8 | 5.8 |
Variable | Britannia | Average |
---|---|---|
% spending less than 30% of household income on shelter costs | 69.2 | 77.3 |
% spending 30% or more of household income on shelter costs | 30.8 | 22.7 |
Variable | Britannia | Average |
---|---|---|
% under $20,000 | 19 | 9.6 |
% $20,000 - $50,000 | 34.6 | 19.5 |
% $50,000 - $80,000 | 26.9 | 20.9 |
% $80,000 - $125,000 | 11.9 | 23.6 |
% $125,000 - $150,000 | 2.5 | 8.4 |
% $150,000 and over | 5.1 | 17.7 |
Variable | Britannia | Average |
---|---|---|
% under $20,000 | 19.7 | 9.8 |
% $20,000 - $50,000 | 41.5 | 24.2 |
% $50,000 - $80,000 | 24.9 | 25.1 |
% $80,000 - $100,000 | 6 | 12.8 |
% $100,000 - $125,000 | 3.1 | 11.2 |
% $125,000 and over | 5 | 16.7 |
Variable | Britannia | Average |
---|---|---|
% owner households | 31.3 | 67.3 |
% tenant households | 68.7 | 32.7 |
% part of a condominium development | 17.8 | 14.7 |
% owner households with a mortgage | 41.7 | 60.3 |
% owner households spending 30% or more of household total income on shelter costs | 17.1 | 14.9 |
Avg. monthly shelter costs for owned dwellings ($) | 1069 | 1318 |
Avg. value of owned dwellings ($) | 317337 | 390255 |
% tenant households in subsidized housing | 20.3 | 16.5 |
% tenant households spending 30% or more of household total income on shelter costs | 37 | 38.7 |
Avg. monthly shelter costs for rented dwellings ($) | 871 | 1065 |
Community & Belonging
Variable | Britannia | Average |
---|---|---|
Overall Walkable Neighbourhood Score | 57 | 50 |
Variable | Britannia | Average |
---|---|---|
Pedestrian infrastructure and amenities | 49 | 50.1 |
Safety from traffic | 42 | 50 |
Street visibility from houses | 51 | 50.3 |
Aesthetics | 46 | 50.3 |
Variable | Britannia | Average |
---|---|---|
% did not move in the past year | 85.6 | 86.5 |
% moved in the past year | 14.4 | 13.5 |
% did not move in the past 5 years | 51.5 | 58.1 |
% moved in the past 5 years | 48.5 | 41.9 |
Variable | Britannia | Average |
---|---|---|
% persons living with relatives | 2.3 | 2.1 |
% persons living with non-relatives | 5.6 | 4.9 |
% persons living alone | 24.5 | 11.5 |
% persons living in census family | 67.6 | 81.5 |
Variable | Britannia | Average |
---|---|---|
% seniors living with relatives | 3 | 5.1 |
% seniors living with non-relatives | 1.7 | 1.8 |
% seniors living alone | 45.7 | 26 |
% seniors living in census families | 50 | 67.1 |
Variable | Britannia | Average |
---|---|---|
% one-family households | 43.6 | 61 |
% two-or-more-family households | 0.5 | 1.4 |
% non-family households | 53.2 | 33.6 |
Economy & Employment
Variable | Britannia | Average |
---|---|---|
Number of employment services | 2 | 0.9 |
Number of employment services per 1000 residents | 0.3 | 0.1 |
Avg. distance to nearest employment service (km) | 1.2 | 6 |
Variable | Britannia | Average |
---|---|---|
Population density (# of people per km2) | 3286 | 2350.8 |
Variable | Britannia | Average |
---|---|---|
% employed | 50.1 | 64.5 |
% unemployed | 5.7 | 4.8 |
% not in the labour force | 44.2 | 30.7 |
Variable | Britannia | Average |
---|---|---|
% did not work in 2010 | 9.6 | 4.7 |
% worked in 2010 | 90.3 | 95.3 |
Variable | Britannia | Average |
---|---|---|
% Without income | 5.3 | 4.5 |
% Without after-tax income | 5.2 | 4.5 |
Variable | Britannia | Average |
---|---|---|
% under $20,000 | 36.2 | 29.1 |
% $20,000 - $50,000 | 33.9 | 27.9 |
% $50,000 - $80,000 | 16 | 20.5 |
% $80,000 - $125,000 | 6.7 | 13.2 |
% $125,000 and over | 2 | 4.7 |
Median resident before-tax income | 27958 | 40259.87 |
Variable | Britannia | Average |
---|---|---|
% under $20,000 | 37.5 | 30.2 |
% $20,000 - $50,000 | 40.6 | 34.6 |
% $50,000 - $80,000 | 11.7 | 21.5 |
% $80,000 - $100,000 | 2.8 | 5.1 |
% $100,000 and over | 2 | 4 |
Median resident after-tax income | 25964 | 35554.9 |
Variable | Britannia | Average |
---|---|---|
% in bottom half of the Canadian income distribution | 61 | 35.3 |
% in top half of the Canadian income distribution | 39 | 64.7 |
% in bottom quintile | 29.7 | 15.3 |
% in second quintile | 23.6 | 12.7 |
% in third quintile | 17.2 | 16 |
% in fourth quintile | 14.1 | 22.5 |
% in top quintile | 15.3 | 33.5 |
Variable | Britannia | Average |
---|---|---|
% 1960 or before | 17.3 | 19.7 |
% 1961 to 1980 | 62.8 | 32.4 |
% 1981 to 1990 | 16.7 | 18.7 |
% 1991 to 2000 | 2.4 | 12.2 |
% 2001 to 2005 | 0.6 | 8.5 |
% 2006 to 2011 | 0 | 8.4 |
Variable | Britannia | Average |
---|---|---|
% industry - Not applicable | 4 | 2 |
% agriculture, forestry, fishing and hunting | 0 | 0.4 |
% mining, quarrying, and oil and gas extraction | 0 | 0 |
% utilities | 0 | 0.2 |
% construction | 3.3 | 4.2 |
% manufacturing | 6 | 3.5 |
% wholesale trade | 1.6 | 2.6 |
% retail trade | 10.3 | 9.8 |
% transportation and warehousing | 2.7 | 2.9 |
% information and cultural industries | 1.7 | 2.7 |
% finance and insurance | 2.7 | 3.4 |
% real estate and rental and leasing | 1.3 | 1.7 |
% professional, scientific and technical services | 9.7 | 9.7 |
% management of companies and enterprises | 0 | 0 |
% administrative and support, waste management and remediation services | 5.9 | 3.7 |
% educational services | 7.3 | 7.4 |
% health care and social assistance | 11.6 | 10 |
% arts, entertainment and recreation | 0.8 | 1.7 |
% accommodation and food services | 8.8 | 6.1 |
% other services (except public administration) | 6.7 | 4.6 |
% public administration | 15.5 | 22.9 |
Variable | Britannia | Average |
---|---|---|
Socioeconomic Status (SES) quintiles | 5 | NaN |
Education & Learning
Variable | Britannia | Average |
---|---|---|
Number of French high schools | 0 | 0.1 |
Number of French high schools per 1000 people | 0 | 0 |
Number of French high schools (with 50m buffer) | 0 | 0.1 |
Number of French high schools per 1000 people (with 50m buffer) | 0 | 0 |
Avg. distance to nearest French high school (km) | 7.5 | 7.2 |
Variable | Britannia | Average |
---|---|---|
Number of French elementary schools per 1000 people (with 50m buffer) | 0 | 0.1 |
Variable | Britannia | Average |
---|---|---|
Number of English high schools | 0 | 0.4 |
Number of English high schools per 1000 people | 0 | 0 |
Number of English high schools (with 50m buffer) | 0 | 0.4 |
Number of English high schools per 1000 people (with 50m buffer) | 0 | 0 |
Variable | Britannia | Average |
---|---|---|
Number of special education programs | 0 | 0 |
Number of special education programs per 1000 residents | 0 | 0 |
Number of special education programs (with 50m buffer) | 0 | 0 |
Number of special education programs per 1000 residents (with 50m buffer) | 0 | 0 |
Avg. distance to nearest special education program (km) | 5.7 | 10.8 |
Variable | Britannia | Average |
---|---|---|
Number of private schools | 0 | 0.4 |
Number of private schools per 1000 people | 0 | 0 |
Number of private schools (with 50m buffer) | 0 | 0.4 |
Number of private schools per 1000 people (with 50m buffer) | 0 | 0.1 |
Avg. distance to nearest private school (km) | 1.6 | 5.5 |
Variable | Britannia | Average |
---|---|---|
Total number of child care programs | 2 | 3 |
Variable | Britannia | Average |
---|---|---|
Number of English child care programs | 2 | 2.3 |
Variable | Britannia | Average |
---|---|---|
% without high school | 12.4 | 6.7 |
% high school | 21 | 18.7 |
% postsecondary (any) | 66.8 | 74.6 |
Environment & Sustainability
Variable | Britannia | Average |
---|---|---|
Cycling network (m) | 8920 | 11825.8 |
Cycling network (m/person) | 1.1 | 1.4 |
Cycling network density (m/km2) | 3.7 | 0.4 |
Pedestrial network (m) | 19708.9 | 27601 |
Pedestrial network (m/person) | 2.5 | 3.2 |
Pedestrial network density (m/km2) | 8.2 | 1 |
Area of all parks and paths (m2) | 405597.1 | 372084.6 |
Area of all parks and paths per person (m2) | 54.2 | 55.7 |
Variable | Britannia | Average |
---|---|---|
Number of Park & Rides | 0 | 0.1 |
Number of Park & Rides per 1000 residents | 0 | 0 |
Avg. distance (km) to nearest Park & Ride | 4.3 | 7.2 |
Variable | Britannia | Average |
---|---|---|
Area of neighbourhood (km2) | 2.4 | 27.1 |
Area (m2) per person | 304 | 7498 |
Variable | Britannia | Average |
---|---|---|
% driver in a car, truck or van | 51.2 | 60.3 |
% passenger in a car, truck or van | 5.3 | 6.4 |
% use public transit | 34.5 | 22.5 |
% walk | 5 | 7.2 |
% bicycle | 3 | 2.5 |
% other methods | 0.8 | 1 |
Variable | Britannia | Average |
---|---|---|
% between 5 and 6:59 a.m | 20.3 | 21.3 |
% between 7 and 9:00 a.m. | 56 | 61.7 |
% anytime after 9:00 a.m. | 23.7 | 17 |
Variable | Britannia | Average |
---|---|---|
Avg. commute duration (minutes) | 25.3 | 23.34 |
General Demographics
Variable | Britannia | Average |
---|---|---|
# Seniors in neighbourhood | 1510 | 1130.6 |
% Seniors in neighbourhood | 19.3 | 13.2 |
% aged 0 to 9 years | 9.1 | 11.1 |
% aged 10 to 19 years | 10.3 | 12.3 |
% aged 20 to 29 years | 15.5 | 14.4 |
% aged 30 to 39 years | 12.1 | 13.4 |
% aged 40 to 49 years | 13.6 | 15.6 |
% aged 50 to 59 years | 14.1 | 14.3 |
% aged 60 to 69 years | 10.9 | 9.8 |
% aged 70 to 79 years | 8.3 | 5.4 |
% aged 80 years and over | 6.3 | 3.7 |
Variable | Britannia | Average |
---|---|---|
Total population | 7820 | 8568.3 |
Total male population | 3605 | 428115 |
Total female population | 4220 | 454490 |
Variable | Britannia | Average |
---|---|---|
% married | 32.7 | 47.4 |
% common-law | 10.2 | 8.5 |
% single (never legally married) | 33.8 | 30.5 |
% separated | 5 | 2.8 |
% divorced | 10.4 | 5.8 |
% widowed | 7.9 | 4.9 |
Variable | Britannia | Average |
---|---|---|
% couple families without children | 44.7 | 38.2 |
% couple families with children | 29.5 | 45.7 |
% lone-parent families | 25.8 | 16.1 |
% female lone-parent families | 22.4 | 12.8 |
% male lone-parent families | 3.7 | 3.2 |
Variable | Britannia | Average |
---|---|---|
% children under 6 years | 21.6 | 21.4 |
% children aged 6-14 years | 33.1 | 32.6 |
% children aged 15-17 years | 11.9 | 12.2 |
% children aged 18-24 years | 21.8 | 22.2 |
% children aged 25 years | 11.3 | 11.6 |
Variable | Britannia | Average |
---|---|---|
% of 1-person households | 47.7 | 28.2 |
% of 2-person households | 30.3 | 33 |
% of 3-person households | 10.3 | 15.8 |
% of 4-person households | 6.8 | 15 |
% of 5-person households | 2.5 | 5.4 |
% of 6-or more person households | 2.4 | 2.6 |
Variable | Britannia | Average |
---|---|---|
% English | 62.3 | 62.4 |
% French | 9.9 | 14.2 |
% English and French | 1 | 1.2 |
% neither English nor French | 25 | 20.4 |
Variable | Britannia | Average |
---|---|---|
% with knowledge of English only | 69.1 | 60 |
% with knowledge of French only | 1.9 | 1.5 |
% with knowledge of both English and French | 27.5 | 37.2 |
% with knowledge of neither English nor French | 1.5 | 1.4 |
Variable | Britannia | Average |
---|---|---|
% with Canadian citizenship | 89.8 | 93.9 |
% without Canadian citizenship | 10.3 | 6.1 |
Variable | Britannia | Average |
---|---|---|
% non-immigrants | 69.9 | 75.3 |
% immigrants | 28.2 | 23.4 |
% recent immigrants (2006 to 2011) | 7.7 | 3.7 |
% non-permanent residents | 1.7 | 1.3 |
Variable | Britannia | Average |
---|---|---|
% of North American Aboriginal origins | 4 | 4.1 |
% of other North American origins | 25.3 | 28.7 |
% of British origins | 43.8 | 44.3 |
% of Western European origins | 28.3 | 32.7 |
% of other European origins | 18.8 | 21 |
% of Caribbean origins | 5.6 | 2.6 |
% of Latin, Central and South American origins | 0.9 | 1.7 |
% of African origins | 11.3 | 5.1 |
% of West Central Asian and Middle Eastern origins | 7.7 | 6.1 |
% of South Asian origins | 2.5 | 4.2 |
% of East and Southeast Asian origins | 6.3 | 7.8 |
% of other Asian origins | 0 | 0 |
% of Oceania origins | 0 | 0.2 |
Variable | Britannia | Average |
---|---|---|
% Buddhist | 1.5 | 1.3 |
% Christian | 60.3 | 65.5 |
% Hindu | 0.4 | 1.4 |
% Jewish | 1.2 | 1.2 |
% Muslim | 9.9 | 6.7 |
% Sikh | 0 | 0.4 |
% traditional (Aboriginal) spirituality | 0 | 0 |
% other religions | 1.5 | 0.6 |
% no religious affiliation | 25.1 | 22.8 |
Variable | Britannia | Average |
---|---|---|
% visible minority | 27.9 | 23.7 |
% not a visible minority | 72.1 | 76.3 |
Health & Wellness
Variable | Britannia | Average |
---|---|---|
Number of defibrillators | 4 | 6 |
Number of defibrillators per 1000 residents | 0.5 | 1.2 |
Avg. distance to a defibrillator (km) | 0.6 | 2.6 |
Variable | Britannia | Average |
---|---|---|
Number of pharmacies | 4 | 2.2 |
Number of pharmacies per 1000 residents | 0.5 | 0.3 |
Avg. distance to a pharmacy (km) | 0.7 | 1.7 |
Number of pharmacies (with 50m buffer) | 4 | 3 |
Number of pharmacies per 1000 residents (with 50m buffer) | 0.5 | 0.3 |
Avg. distance to closest 3 pharmacies (km) | 0.9 | 2.2 |
Variable | Britannia | Average |
---|---|---|
Number of CHRCs | 1 | 0.1 |
Avg. distance to nearest CHRC (km) | 1.1 | 7 |
Variable | Britannia | Average |
---|---|---|
Number of dentists | 3 | 5.8 |
Number of dentists per 1000 people | 0.4 | 0.7 |
Avg. distance to nearest dentist (km) | 0.9 | 1.7 |
Avg. distance to nearest 3 dental clinics (km) | 1.3 | 2.1 |
Number of dental clinics | 1 | 3.3 |
Number of dental clinics per 1000 people | 0.1 | 0.4 |
Number of dental clinics (with 50m buffer) | 1 | 4.5 |
Number of dental clinics per 1000 people (with 50m buffer) | 0.1 | 0.5 |
Number of dentists (with 50m buffer) | 3 | 8.1 |
Number of dentists per 1000 people (50m buffer) | 0.4 | 0.9 |
Variable | Britannia | Average |
---|---|---|
Avg. distance to a mental health service location (km) | 1.1 | 9.6 |
Number of mental health service locations | 1 | 0.3 |
Variable | Britannia | Average |
---|---|---|
Number of needle drop boxes | 0 | 0.5 |
Number of needle drop boxes per 1000 people | 0 | 0.1 |
Avg. distance to a needle drop box (km) | 3.3 | 5.2 |
Variable | Britannia | Average |
---|---|---|
Number of youth services | 3 | 0.8 |
Number of youth services per 1000 residents | 0.4 | 0.1 |
Variable | Britannia | Average |
---|---|---|
Number of optometrists | 1 | 1.9 |
Number of optometrists per 1000 residents | 0.1 | 0.2 |
Avg. distance to nearest optometrist (km) | 1.1 | 4.7 |
Variable | Britannia | Average |
---|---|---|
Number of Physicians | 7 | 9.7 |
Number of Physicians per 1000 residents | 0.9 | 1.2 |
Avg. distance to nearest physician (km) | 0.8 | 2.8 |
Variable | Britannia | Average |
---|---|---|
Emergency visit rate for ACSC (per 100,000) | 7195.4 | 5214.6 |
Hospitalization rate for ACSC (per 100,000) | 961.1 | 748.5 |
Variable | Britannia | Average |
---|---|---|
ED visits for all unintentional injuries (per 100,000) | 8832.1 | 7361.8 |
ED visits for falls (per 100,000) | 2950.7 | 2389.2 |
Hospitalizations for all unintentional injuries (per 100,000) | 418.6 | 375.3 |
Hospitalizations for falls (per 100,000) | 267.3 | 253.6 |
~ Child Care
Variable | Britannia | Average |
---|---|---|
Number of French elementary schools | 0 | 0.5 |
Number of French elementary schools per 1000 people | 0 | 0.1 |
Number of French elementary schools (with 50m buffer) | 0 | 0.5 |
Avg. distance to nearest French elementary school (km) | 2.1 | 4.9 |
Variable | Britannia | Average |
---|---|---|
Number of English elementary schools | 1 | 1.7 |
Number of English elementary schools per 1000 people | 0.1 | 0.2 |
Number of English elementary schools (with 50m buffer) | 1 | 1.8 |
Number of English elementary schools per 1000 people (with 50m buffer) | 0.1 | 0.2 |
Avg. distance to nearest English elementary school (km) | 0.7 | 2.2 |
Variable | Britannia | Average |
---|---|---|
Infant children on CCRAW | 11 | 28.9 |
Toddlers on CCRAW | 8 | 11.7 |
Preschool children on CCRAW | 4 | 11.3 |
School age children on CCRAW | 16 | 21.3 |
Total children on CCRAW | 39 | 73.3 |
Children identified with special needs on CCRAW | 2 | 2.1 |
Children approved for fee subsidy on CCRAW | 7 | 6.1 |
Children waiting for full fee space on CCRAW | 32 | 67.1 |
Children identified as francophone on CCRAW | 8 | 26.9 |
Children identified as Aboriginal on CCRAW | 1 | 1.1 |
Variable | Britannia | Average |
---|---|---|
Total Capacity for Infants | 0 | 6 |
Total Capacity for Toddlers | 0 | 30 |
Total Capacity for Preschool children | 56 | 77.1 |
Total Capacity for School age children | 60 | 90.3 |
Variable | Britannia | Average |
---|---|---|
Number of French child care programs | 0 | 0.8 |
Variable | Britannia | Average |
---|---|---|
% of children low on at least 1 of the 5 scales | 45.6 | 26.1 |
% of children in the lowest 10th percentile for physical health and well-being | 24.6 | 12.6 |
% of children in the lowest 10th percentile for social competence | 14 | 9 |
% of children in the lowest 10th percentile for emotional maturity | 17.9 | 11.7 |
% of children in the lowest 10th percentile for language and cognitive development | 12.3 | 6.6 |
% of children in the lowest 10th percentile for communication skills and general knowledge | 15.8 | 9.7 |
Variable | Britannia | Average |
---|---|---|
Number of private home child care agencies servicing neighbourhood | 2 | 3.2 |
Variable | Britannia | Average |
---|---|---|
% English (At Home) | 76.7 | 74.8 |
% non-official language (At Home) | 12.9 | 10.5 |
% French (At Home) | 5.5 | 9.9 |
% with Aboriginal identity | 2 | 2.1 |
Variable | Britannia | Average |
---|---|---|
% of total population living in low income after taxes (LIM-AT) | 25.8 | 11.6 |
% of population aged under 6 living in low income after taxes (LIM-AT) | 42.9 | 15.8 |
Total # of children | 1970 | 2579.7 |
# of children aged under 6 yrs | 420 | 566.1 |
# of children aged 6-14 yrs | 660 | 866.7 |
Average # of children per family | 1 | 1 |
Number of children aged under 6 living in low income | 180 | 89 |
Variable | Britannia | Average |
---|---|---|
Number aged 0 to 4 years | 345 | 477 |
Number aged 5 to 9 years | 365 | 473.1 |
~ Community Resources & Services
Variable | Britannia | Average |
---|---|---|
Avg. distance to nearest healthy financial service (km) | 0.9 | 2.8 |
Avg. distance to nearest 10 healthy financial services (km) | 5.5 | 7.8 |
Avg. number of healthy financial services within 1 km | 1.2 | 1 |
Avg. distance to nearest alternative financial service (km) | 0.7 | 5.9 |
Avg. distance to nearest 10 alternative financial services (km) | 6.6 | 11.1 |
Avg. number of alternative financial services within 1 km | 2 | 0.6 |
Number of alternative financial services | 3 | 0.8 |
Number of healthy financial services | 2 | 2.2 |
Number of alternative financial services per 1000 people | 0.4 | 0.1 |
Number of healthy financial services per 1000 people | 0.3 | 0.2 |
Variable | Britannia | Average |
---|---|---|
Number of Aboriginal resource centres | 0 | 0.2 |
Number of Aboriginal resource centres per 1000 residents | 0 | 0 |
Avg. distance to nearest Aboriginal resource centre (km) | 8.6 | 12.6 |
Variable | Britannia | Average |
---|---|---|
Number of Francophone services | 0 | 0.6 |
Number of Francophone services per 1000 residents | 0 | 0.1 |
Avg. distance to nearest Francophone service (km) | 2.5 | 7.7 |
Variable | Britannia | Average |
---|---|---|
Number of immigrant services | 1 | 0.4 |
Number of immigrant services per 1000 residents | 0.1 | 0 |
Avg. distance to nearest immigrant service (km) | 1.4 | 6.6 |
Variable | Britannia | Average |
---|---|---|
Avg. distance to a farmer's market (km) | 2.9 | 5.6 |
Number of farmer's markets | 0 | 0.2 |
Number of farmer's markets per 1000 people | 0 | 0 |
Variable | Britannia | Average |
---|---|---|
Avg. distance to a Good Food Box (km) | 2.8 | 7 |
Avg. number of Good Food Boxes within 1.5 km of majority of population | 1.2 | 0.4 |
Number of Good Food Boxes per 1000 people | 0 | 0 |
Number of Good Food Boxes | 0 | 0.3 |
Variable | Britannia | Average |
---|---|---|
Avg. distance to nearest grocery store (km) | 0.8 | 4 |
Number of grocery stores | 2 | 0.8 |
Number of grocery stores per 1000 people | 0.3 | 0.1 |
Variable | Britannia | Average |
---|---|---|
Avg. distance to nearest specialty food store (km) | 0.7 | 2.4 |
Number of specialty food stores | 4 | 3.9 |
Number of specialty food stores per 1000 people | 0.5 | 0.5 |
Variable | Britannia | Average |
---|---|---|
Avg. distance to nearest restaurant (km) | 0.7 | 1.9 |
Number of restaurants | 7 | 9.5 |
Number of restaurants per 1000 people | 0.9 | 1.2 |
Variable | Britannia | Average |
---|---|---|
Avg. distance to nearest mobile food trucks (km) | 1 | 5 |
Number of mobile food trucks | 1 | 0.3 |
Number of mobile food trucks per 1000 people | 0.1 | 0 |
Variable | Britannia | Average |
---|---|---|
Avg. distance to nearest fast food outlet (km) | 0.7 | 2 |
Number of fast food outlets | 13 | 12 |
Number of fast food outlets per 1000 people | 1.7 | 1.4 |
Variable | Britannia | Average |
---|---|---|
Number of convenience stores | 6 | 5.4 |
Avg. distance to nearest convenience store (km) | 0.6 | 1.5 |
Number of convenience stores per 1000 people | 0.8 | 0.7 |
Variable | Britannia | Average |
---|---|---|
Avg. distance to nearest community garden (km) | 1.6 | 7.4 |
Number of community gardens | 0 | 0.3 |
Number of community gardens per 1000 people | 0 | 0 |
Variable | Britannia | Average |
---|---|---|
Number of Beer Stores | 0 | 0.2 |
Avg. distance to nearest Beer Store (km) | 3.8 | 6 |
Variable | Britannia | Average |
---|---|---|
Number of Wine Racks | 1 | 0.2 |
Avg. distance to nearest Wine Rack (km) | 1.2 | 6.3 |
Variable | Britannia | Average |
---|---|---|
Number of LCBOs | 0 | 0.3 |
Average distance to nearest LCBO (km) | 2.6 | 4.6 |
~ Crime
Variable | Britannia | Average |
---|---|---|
# Other Criminal Code Offences (total) | 45 | NaN |
Other Criminal Code Offences (total), per 100,000 | 575 | 397.1 |
Variable | Britannia | Average |
---|---|---|
# Arsons | 1 | NaN |
# Break and Enters | 23 | NaN |
# Fraud incidences | 38 | NaN |
# Mischief | 49 | NaN |
# Possession of Stolen Goods | 1 | NaN |
# Motor Vehicle Theft | 8 | NaN |
# Thefts ($5000 and under) | 131 | NaN |
# Thefts (over $5000) | 0 | NaN |
# Crimes against the property (total) | 251 | NaN |
Crimes against the property (total), per 100,000 | 3210 | 2295.5 |
Variable | Britannia | Average |
---|---|---|
# Abductions | 1 | NaN |
# Assaults | 32 | NaN |
# Attempted Murders | 0 | NaN |
# Homicide Incidences | 0 | NaN |
# Other Offences | 8 | NaN |
# Robberies | 3 | NaN |
# Sexual Violations | 8 | NaN |
# Uttering Threats or Intimidation | 7 | NaN |
# Crimes against the person (total) | 59 | NaN |
Crimes against the person (total), per 100,000 | 754 | 543 |
Variable | Britannia | Average |
---|---|---|
# Total Criminal Code of Canada Offences (Excl. Traffic) | 355 | NaN |
Total Criminal Code of Canada Offences (Excl. Traffic), per 100,000 | 4540 | 3235.6 |